
 Email:
  Tel:+86-13486478562
 Language
  Español
 Português
Precision Manufacturing / Maintenance Diagnostics
The Quiet Signals of a Clogging Nozzle
Long before a coating defect reaches the naked eye, the machine is already telling you something. Learning to read vacuum pressure, deposition rate, and thickness variance turns a five-hour teardown into a five-minute fix.
Direct Answer: Key Warning Signs of Nozzle Clogging
Operators can identify early signs of coating machine nozzle clogging by monitoring four measurable indicators: a drop in chamber vacuum stability, uneven film thickness readings, irregular deposition rate on the crystal monitor, and visible splutter or arcing at the source material feed point. In most vacuum coating machine setups, a partially blocked nozzle or evaporation source reduces material throughput by 15% to 40% before the defect becomes visible on the finished substrate. Catching these signals during the first shift of a production run, rather than after a full batch has been processed, is what separates routine maintenance from costly rework.
The sections below break down each indicator, the diagnostic tools used to confirm them, and the maintenance intervals that prevent recurring blockages.
Why Nozzle Clogging Happens in the First Place
Before an operator can catch early warning signs, it helps to understand what causes the blockage. Coating nozzles and evaporation crucibles accumulate residue for a few predictable reasons: condensed vapor re-solidifying near the aperture, oxidized particulates from source material that has been reused too many times, and outgassing byproducts from substrates that were not properly cleaned before loading. In a typical metalizing machine, aluminum wire feeding through a resistance-heated boat can leave behind micro-splatter that gradually narrows the vapor stream path. Over dozens of cycles, that narrowing changes the geometry of the deposition pattern, which is exactly what shows up first in the readings discussed below.
Humidity, chamber cleanliness, and source material purity all affect how quickly this buildup occurs. A facility running at 99.9% pure aluminum wire will see far less residue accumulation than one using reclaimed or lower-grade stock, and this is one of the most overlooked variables when operators try to diagnose recurring clogging issues.
Monitoring Vacuum Pressure Fluctuations
The chamber vacuum gauge is the single most reliable early-warning instrument on any vacuum coating machine. A properly functioning system should hold within a narrow pressure band once the target vacuum level is reached, typically in the range of 10⁻³ to 10⁻⁵ mbar depending on the coating process. When a nozzle or evaporation source begins to clog, outgassing patterns shift and pressure readings become unstable, often showing a slow creep upward of 5% to 10% during a run that previously held steady.
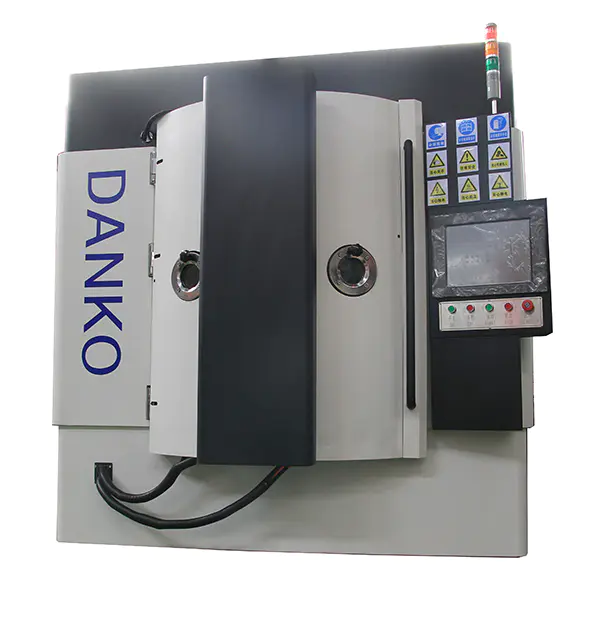
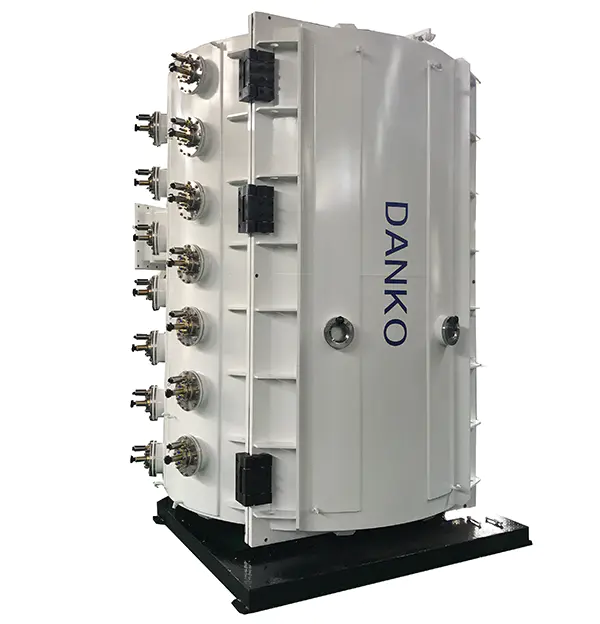
vacuum coating machine
What to Track on the Gauge
Operators should log the base pressure at the start of each cycle and compare it against the historical average for that recipe. A deviation greater than 8% from baseline, without a corresponding change in load size or pump-down time, is a strong indicator that residue is building up around the source or nozzle assembly.
| Pressure Deviation | Likely Cause | Recommended Action |
|---|---|---|
| Under 3% | Normal variance | Continue standard monitoring |
| 3% to 8% | Early residue buildup | Schedule inspection at next changeover |
| Over 8% | Partial nozzle or source blockage | Stop run and inspect immediately |
Reading the Quartz Crystal Deposition Monitor
The deposition rate monitor gives a second, independent confirmation of clogging before any visible defect appears on the substrate. A healthy nozzle or evaporation source produces a linear, predictable rate curve. When residue narrows the aperture, the rate curve typically flattens or dips by 10% to 25% compared to the recipe's target rate, even though the power input to the source remains constant.
Operators running a metalizing machine for reflective film or packaging substrates should watch specifically for a rate that starts strong and tapers mid-cycle, since this pattern often points to gradual clogging rather than a source material shortage. If the rate recovers after the crucible is refilled but degrades again at a similar point in the next cycle, that repeatable pattern is a strong sign that the nozzle geometry itself needs cleaning rather than the material supply.
- Record the target deposition rate for the recipe before starting the cycle.
- Compare the live rate reading at the 25%, 50%, and 75% marks of the cycle.
- Flag any sustained drop greater than 10% for inspection at the next scheduled stop.
- Cross-check the rate deviation against the vacuum pressure log for the same cycle.
Visual and Thermal Indicators During Operation
Beyond the instrumentation, trained operators can catch clogging through direct observation of the source during operation, provided the chamber has a viewport or camera system. Common visual cues include:
- Uneven glow or arcing at one section of the evaporation boat rather than a uniform vapor plume
- Sparking or spitting near the nozzle edge, indicating trapped oxidized particulate
- A visibly narrowed or discolored vapor stream compared to earlier cycles
- Localized hot spots detected on thermal imaging near the aperture, often 20°C to 40°C higher than surrounding areas
Thermal imaging is particularly useful in high-throughput facilities where a vacuum coating machine runs multiple shifts back to back, since gradual clogging tends to raise localized resistance heating around the blocked area well before it shows up in the deposition rate.
Inspecting Substrate Thickness Uniformity
Once material has been processed, thickness mapping across the substrate width reveals clogging patterns that instrumentation may have missed mid-cycle. A properly functioning nozzle produces a uniform coating within ±5% of target thickness across the width of the substrate. When clogging is underway, thickness readings often show a localized dip of 10% or more directly downstream of the affected nozzle segment, while the rest of the substrate remains within tolerance.
| Variance Pattern | Diagnostic Meaning |
|---|---|
| Uniform drop across entire width | Source material depletion, not clogging |
| Localized dip in one zone | Partial nozzle blockage in that zone |
| Progressive thinning cycle over cycle | Gradual residue buildup, needs cleaning soon |
Info
Running a thickness map every 500 to 1,000 substrates, rather than only at shift changeovers, gives operators enough resolution to catch the transition from "early buildup" to "active blockage" before scrap rates climb.
Setting Up a Preventive Cleaning Schedule
Detecting early signs is only half the solution; pairing detection with a preventive cleaning interval reduces unplanned downtime significantly. Facilities that inspect and clean nozzles or evaporation sources every 40 to 60 operating hours, rather than waiting for a defect to appear, typically report 30% fewer unplanned stoppages related to clogging. The exact interval depends on source material purity, substrate outgassing levels, and chamber cleanliness, so operators should treat published intervals as a starting point and adjust based on their own logged data.
Building a Simple Tracking Log
A basic log recording vacuum baseline, deposition rate deviation, and thickness variance for each cycle creates a trend line that flags clogging days before it becomes visible on a finished part. Many facilities running a metalizing machine for high-volume packaging film find that this log alone reduces reactive maintenance calls, since the pattern of degradation becomes predictable rather than sudden.
Success
A consistent 40–60 hour cleaning cadence, paired with a simple three-metric log, is enough to shift most lines from reactive repair to predictable maintenance.
Common Mistakes Operators Make When Diagnosing Clogging
Several recurring mistakes delay early detection and turn a minor issue into a full production stop. First, operators sometimes attribute a slow deposition rate solely to low source material without checking the vacuum log for a corresponding pressure shift, missing the clogging signal entirely. Second, thickness mapping is often performed too infrequently to catch a developing trend, especially on lines running long, uninterrupted batches. Third, visual inspection through a viewport is frequently skipped during high-speed runs, even though a five-second glance can reveal an uneven vapor plume that no sensor is tracking.
Warning
Relying on a single metric — rate, pressure, or thickness alone — delays detection. Clogging is confirmed by the pattern across all three, not by any one reading in isolation.
Danger
Ignoring a repeatable rate-taper pattern across multiple cycles risks a full source or nozzle failure mid-batch, which can scrap the entire run rather than a single segment of substrate.
Correcting these habits does not require new equipment in most cases. It requires a consistent checklist applied at fixed intervals, combined with a log that lets operators compare today's readings against the machine's own history rather than a generic factory-default baseline.
Final Takeaway for Operators
Early nozzle clogging on a vacuum coating machine or metalizing machine rarely appears as a single dramatic failure. It shows up first as small, measurable drifts: a vacuum reading a few percent off baseline, a deposition rate curve that tapers instead of holding steady, and thickness maps with a localized dip that grows cycle over cycle. Operators who log these three indicators consistently, and who pair that data with a fixed preventive cleaning interval, catch the problem while it is still a five-minute cleaning task rather than a multi-hour teardown and requalification.






 Tel: +86-13486478562
 FAX: +86-574-62496601
 Email:
  Address: No. 79 West Jinniu Road, Yuyao, Ningbo City, Zhejiang Provice, China